Poznan Racetrack. A historic facility in dispute with new residential development

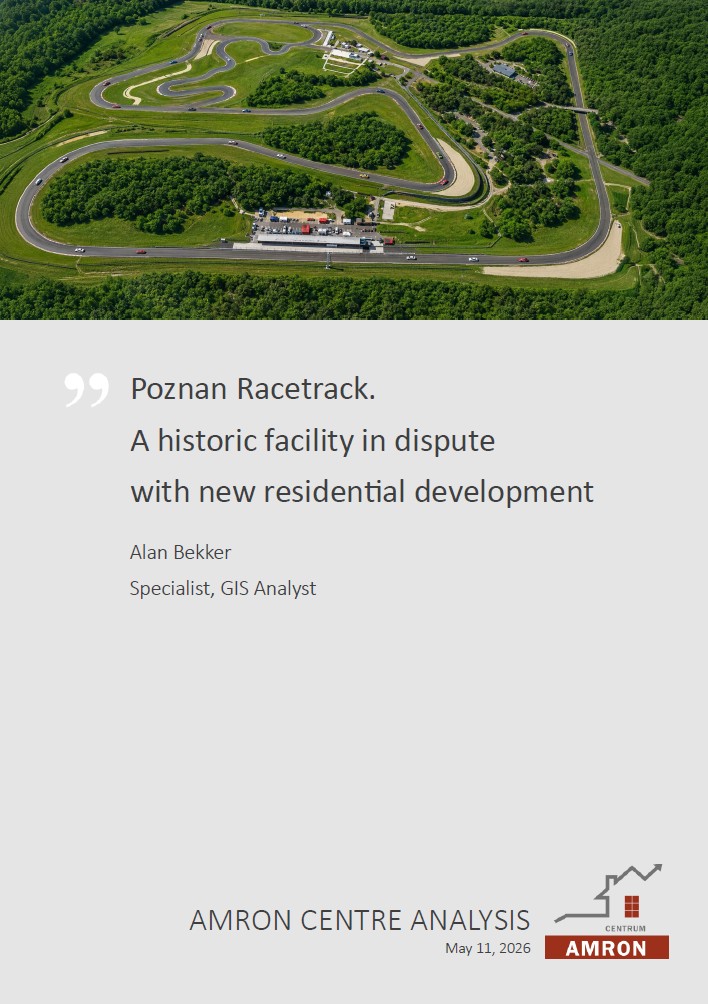
The Poznan Racetrack case gained publicity following information about a decision upholding an order to suspend the use of installations on the site. This triggered strong opposition from motorsport fans, particularly visible on social media. The facility, however, did not remain out of use for long. The Chief Inspectorate for Environmental Protection announced that the enforcement of the decision of March 31, 2026 had been suspended until the case is resolved by the Provincial Administrative Court. In practice, this means that Poznan Racetrack may currently operate under the existing conditions. The matter has not, however, been finally concluded and the risk of restrictions on the track’s operations remains real.

For many people connected with motorsport, significance of Poznan Racetrack goes beyond the local dimension. For years, it has been associated not only with racing and motorsport, but also with training and other automotive events. At the same time, a dispute has been growing around the track, bringing into conflict arguments concerning residents’ right to a comfortable life, applicable environmental standards and the protection of a facility that has operated in this location for almost half a century.

This supra-local importance is well illustrated by the history of the Poznan Racetrack. When the facility opened in December 1977, it was the only major racing circuit in Poland and a symbol of sporting ambitions pursued on the eastern side of the Iron Curtain. For decades, it maintained its position as the country’s most important permanent racing circuit. Today, the paradox is that almost 50 years later Poland may face the prospect of losing its only homologated circuit of international significance. The Poznan Racetrack remains the only facility in Poland homologated by the FIA, which gives the entire case a dimension extending beyond the vicinity of Przeźmierowo and Poznań.

In this dispute, the historical argument frequently returns. The Poznan Racetrack was built in the 1970s on the site of a former military training ground, exploiting the old, no longer used runways of Ławica Airport. The facility was therefore operating long before a large part of the current residential development appeared in its vicinity. The dispute concerns primarily the noise generated by racing cars, but it is worth remembering that cars were already driving there when building plots were being sold in the area and development permits were being issued. This leads to the question of whether the current conflict could have been avoided through appropriate spatial planning and by allowing in the area only such a direction of space development as would have been adequate to the neighbourhood of an existing racing circuit.

The background to this story is the development of Przeźmierowo and the surrounding area. In recent decades, this area has undergone intensive urbanisation as part of the residential hinterland of the Poznań agglomeration. In the case of Poznan Racetrack, the conflict did not appear suddenly, but grew as development in the vicinity of the facility expanded.

An economic argument also appears in the public debate. The proximity of the racing circuit and the airport may have been one of the factors affecting property price levels in this area. Viewed in this way, some buyers may have decided to purchase because of more attractive prices, while at the same time being aware of the specific nature of the location and the lower life comfort associated with it. According to historical data from the AMRON database, in 2003-2004, i.e. in the period preceding the largest increase in the number of Przeźmierowo residents, building plots there cost on average PLN 115 per sqm. Currently, according to up-to-date data from the same database, the average price is PLN 825 per sqm. On the other hand, residents argue that regardless of when the facility was built or how property values have changed, they have the right to expect compliance with the applicable standards. This is why the dispute today has not only an emotional and economic dimension, but also a formal and administrative one.

One of the key threads in the Poznan Racetrack case is spatial planning. For years, development in the vicinity of the facility took place in conditions, in which there were no effective tools that would clearly separate the residential function from areas exposed to noise. Until recently, the study of conditions and directions of spatial development, as the main planning document in a municipality, did not have the legal force to prohibit residential development within a specified distance from the circuit. In the absence of local spatial development plans, successive projects could therefore be built on the basis of decisions on development conditions. As a result, residential development began to move closer to the circuit.

Today, the formal situation is different: studies have been replaced by general plans, which have legal force, while local spatial development plans specify their provisions in greater detail. If a similar facility as the Poznan Racetrack was built today, it would be possible to designate a buffer zone around it, intended, for example, for insulating greenery or industrial development, which would separate residential development from the area exposed to excessive noise. The general plan of the Tarnowo Podgórne municipality, the draft of which was subject to public consultation in January 2026, also appears in the background of the case.

Additionally, both technical and legal dimensions of the case also remain important. The basis for the authorities’ actions was the identified exceedance of permissible noise levels. The difference between levels of 55 and 50 dB, which to a layman may appear negligible,  is often refrained in the public sphere. In administrative proceedings, however, such parameters are highly significant, because they may determine whether a facility is permitted to operate in a specific environment. In practice, the issue is therefore not merely an apparently small numerical difference, but a threshold, on which the legal assessment of the circuit’s impact on its surroundings depends.

The operators of the circuit, in turn, emphasise that the facility is taking measures to reduce noise. Residents, meanwhile, argue that regardless of the circuit’s tradition, environmental standards must be met. As a result, the dispute is not limited solely to the question of who is right, but concerns a difficult attempt to reconcile two legitimate interests: the protection of residents’ living conditions and the preservation of an important sports facility.

The issue of noise around the Poznan Racetrack should also be considered in the broader context of location. The facility operates in the immediate vicinity of Poznań-Ławica Airport, for which a restricted use area has been established due to the airport’s acoustic impact. This shows that this part of the agglomeration for years has not been a typical quiet residential area, but rather a space, where residential functions coexist with burdensome transport and sports infrastructure. From this perspective, the dispute over the Poznan Racetrack is not only about the circuit itself, but also about a broader question concerning the future of the entire surrounding area and whether, if the racing facility were eventually closed, the airport would become the next source of conflict.

For now, the most important point remains that the case has not been finally resolved. Enforcement of the decision has been suspended and the further course of events depends on the court and the subsequent actions of the parties to the proceedings. Regardless of the outcome of this specific case, the conflict around the Poznan Racetrack has already become an example of a broader problem: how to reconcile the development of residential housing with the presence of older infrastructure and sports facilities. This question will be important not only for Przeźmierowo and the area around the circuit, but also for many other places, where land-use functions have begun to clash. A very important task for planners remains to resolve existing spatial conflicts and to pursue a wise, long-term spatial policy that will make it possible to shape the environment in a way that does not generate new disputes.

Alan Bekker
Specialist, GIS Analyst

Potential outcomes of the Persian Gulf war on the Polish housing market

At the beginning of the year, it still seemed that the outlook for the Polish housing market was beginning to improve noticeably. After a long period of elevated inflation and monetary policy tightening, as well as short-lived, but significant disruptions related to the Safe Mortgage 2% programme, the first signs of stabilisation began to emerge. On the mortgage market, a clear recovery was recorded in the third and fourth quarters of last year: the number of newly granted loans approached 65 000, while their value reached approximately PLN 30 billion. At the same time, the housing market saw a slowdown in price growth, which in practice meant price stabilisation after an earlier period of strong increases.

Analytical commentaries were dominated by the so-called “soft landing” scenario. It was assumed that inflation would gradually return to target, interest rates would slowly begin to fall and the mortgage market would rebuild as households’ creditworthiness improved. In such an environment, with housing availability increasing, the market was expected to enter a phase of moderate recovery: without sharp price increases, but with a growing number of transactions and improving liquidity.

This scenario, however, was based on the assumption of a relatively stable external environment. Meanwhile, on February28, a break-through event occurred — a joint attack on Iran conducted by the United States and Israel. Although its initial phase was military in nature, its consequences very quickly extended beyond the military sphere. Strikes on energy infrastructure were of key importance, both direct and retaliatory, affecting extraction facilities, refineries, export terminals and elements of transmission networks. Even where the damage was not total, serious operational disruptions emerged: interruptions in the operation of installations, logistical problems and restrictions on exports of raw materials.

From the perspective of the global economy, the situation in the Strait of Hormuz, one of the most important routes for transporting energy commodities, proved crucial. Around one third of global oil trade and a significant share of LPG and CNG pass through this route. Iran’s actions led to actual destabilisation of this bottleneck — not necessarily through a formal blockade, but through an increase in shipping risk. Incidents involving tankers, the presence of military forces or the threat of mining were enough for some shipowners to suspend transport or begin avoiding the region. As a result, there was a real reduction in oil supply on global markets and increased uncertainty regarding the continuity of deliveries.

The energy market reacted immediately. Brent crude prices exceeded USD 100 per barrel, temporarily approaching USD 107, while European gas prices rose to levels above EUR 60 per MWh. Importantly, analysts emphasise that even in the event of a de-escalation of the conflict, a return to previous price levels will not be quick. Rebuilding commodity flows may take months, while the process of restoring shipping safety, including clearing transport routes, may be lengthy. This means that the energy shock is not only sudden, but also potentially persistent.

Under these circumstances, the International Monetary Fund lowered its forecasts for global economic growth, estimating world GDP growth in 2026 at approx. 3.1%. At the same time, it was indicated that without the energy shock, the forecasts would have been higher. Against this background, Poland’s outlook deteriorated relatively slightly: expected GDP growth is around 3.3% in 2026 and 2.4% in 2027, which means a correction, but not a change in the overall picture of the Polish economic situation. Poland remains among the economies with relatively stable prospects, due, among other factors, to its lower dependence on oil and gas than many other EU countries and its capacity to cushion shocks through public policy. Public investments, including investment financed under the National Recovery Plan, also remain an important stabilising factor, as — unlike consumption — it is less sensitive to fluctuations in energy prices and supports economic activity during periods of heightened uncertainty. As a result, despite the expected rise in inflation to around 4% and the persistence of higher oil prices, estimated in some scenarios at around USD 90 per barrel in 2026, Poland’s macroeconomic fundamentals remain relatively resilient.

From the perspective of the housing market, two channels of transmission of the fuel market shock appear to be of key importance. First: the cost shock — more expensive energy increases the costs of producing construction materials, transport and project execution. Second: the demand shock — higher inflation reduces households’ real incomes and their creditworthiness. It is this second channel that is particularly important, because earlier optimism in forecasts was largely based on the expected decline in interest rates and improved availability of credit.

Under current conditions, this scenario is at least postponed. The most likely response of the Monetary Policy Council appears to be a shift into “wait-and-see” mode, meaning that interest rates will be kept stable for a longer period. To some extent, this will limit the pace of recovery in credit demand on the housing market and will prompt some households to postpone purchase decisions.

However, it cannot be ruled out that, in conditions of rising uncertainty, some buyers may try to get ahead of a potential deterioration in financing conditions and an increase in housing prices caused by rising construction costs, by taking out mortgage loans with periodically fixed interest rates and accelerating purchase decisions. Although temporary, such an effect may cushion the decline in market activity by concentrating demand in the short term. The likelihood of this scenario is confirmed by data from the Credit Information Bureau as for March of this year. The increase in volume of granted mortgage loans compared with the number recorded in March 2025 amounted to 59%, while in terms of value the increase was even higher, at 72.2%. In short term, we could therefore observe some pressure on housing price growth, especially as developers’ activity in the first quarter was clearly lower than in previous years. In the medium term, the impact of the conflict on housing market demand should gradually fade, although a scenario of persistently reduced demand for housing appears likely, mainly due to weaker growth in households’ real incomes.

The supply side is also not free from tensions. As early as March, the first significant increases in construction material prices appeared (expanded polystyrene) and according to the market information, there are already problems with the availability of certain products, suggesting that the market is preparing for a wave of price increases. These are expected as early as in the second quarter of the year. Rising construction costs and greater uncertainty, with limited although recovering demand, may in turn lead some development companies to temporarily refrain from launching new projects.

In longer term, if elevated energy commodity prices persist, we may witness limited structural changes in the market and energy efficiency becoming an increasingly important factor in housing market choices. This may lead to an acceleration of market stratification: new, energy-efficient apartments would gain a demand advantage, while older housing stock, with higher operating costs, could lose relative attractiveness. As a result, price differences between market segments could deepen.

It therefore seems unlikely that the conflict between the United States and Israel and Iran, despite its economic consequences on a global scale, will have dynamic effects on the Polish housing market. We may rather expect a certain temporary weakening of housing demand, accompanied by a decline in developers’ activity resulting both from uncertainty and from the reduced profitability of projects in a situation of elevated costs and stabilisation or very limited increases in housing prices. In longer term, a return to the recovery scenario seems likely, although its pace remains uncertain. What is currently certain is only the very high level of uncertainty regarding further developments, resulting both from divergent signals coming from the conflict region and from inconsistent, or even internally contradictory, political messages, especially on the US side, which make it difficult to assess the durability of the shock and its further economic consequences.

Jerzy Ptaszyński
Research and Market Service Director

Undeveloped land – a foundation for fulfilling dreams or a maze with no way out?

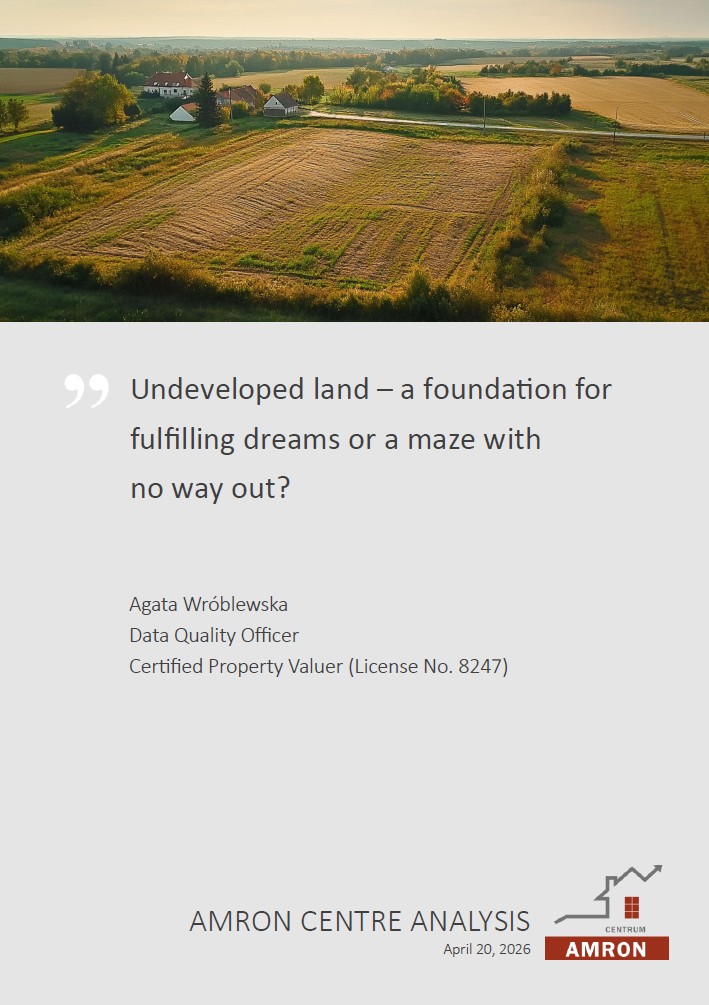
It all starts with the land – this phrase could be a perfect starting point for discussing the value of unbuilt land in development and investment processes, both large-scale and or within the reach of the average Kowalski. Every unbuilt plot carries inherent value. Since the release of the RCN, access to information regarding the value of traded real estate is open to everyone. However, having information on value alone is not sufficiently reliable to determine whether a similar property will achieve a comparable price. Price is influenced by many factors not listed in the reports provided by county offices, nor are they available in a single, condensed file or location that everyone can access. So, what should guide you when choosing an undeveloped plot?

Purpose of purchase – perspective matters

The value of a property is the price a buyer is willing to pay for land he or she intends to use in a specific way. An investor planning to build a complex of recreational buildings for year-round profit will value a plot differently than a private individual planning to build a summer cottage as an escape from the city bustle. The price both buyers are willing to pay is strongly correlated with their objective; an experienced investor will buy a plot at a price that allows for a specific profit upon completion, even if that price is higher than the one Kowalski would pay. Kowalski is able to pay a price that his financial situation allows, while attempting to verify if the purchase price is not exceptionally high compared to local transactions. Kowalski is also driven by emotions and individual preferences, which impact budget flexibility. While an investor has established frameworks and knows exactly how to “squeeze” value out of a plot, Kowalski is thrown into a thicket of information without the tools to prune away incomplete, erroneous or flawed data. The opening of the RCN translated into access to information, but no one provided a manual on how to use these informational benefits. Verifying transactions from county offices requires effort – the GML format is not as commonly used by ordinary users as Excel. Various tools are advertised to convert GML into tabular forms, but these tools merely move data from one format to another. They do not fill in gaps, verify data accuracy or organize information; they just place it in a table. The resulting file lacks many details crucial for a buyer wishing to independently compare an asking price to transaction prices. A GML conversion tool cannot replace analysis; even a sophisticated algorithm cannot fill in missing yet vital information, such as troublesome neighbours or terrain slopes that might make a dream project impossible.

Land use designation – restricting in the name of order, coherence and protection

Land use designation is one of the primary features defining value, yet it remains closely linked to the purpose of the purchase. The current planning situation includes areas covered by adopted General Plans and areas where they have not yet been implemented. In the latter, Local Spatial Development Plans (MPZP) or documents defining development directions, such as the Study of Conditions and Directions for Spatial Development, still apply. The “Studium” is not a planning document and does not define land use, it merely indicates the direction, in which development should evolve. General Plans and Local Plans define primary and often supplementary land use. Development must comply with plan requirements, such as the ratio of biologically active area, building height or minimum plot size in case of subdivision. This brings us back to the first point: the purpose of the purchase. Kowalski looking for a summer cottage will not be interested in a plot with designation that prohibits it. In data provided by county offices, land designation in the vast majority of cases is not indicated, therefore, such transactions should not be included in an analysis without first supplementing the land-use information independently. Plot A within a plan’s scope may have a drastically different value than Plot B located 1 km away, where the plan no longer applies. The same municipality, the same town, perhaps similar utility access, size and shape — yet different prices. Another “value” of land-use designation is maintaining spatial order (though this is a subject of endless debate) and protecting environmentally or culturally significant areas. Proximity to environmentally valuable areas can limit the type and size of an investment. Depending on the goal, this could be an advantage or a disadvantage. Given the ongoing implementation of municipal General Plans, one must approach current designations in Local Plans with caution. In municipalities, where a General Plan is not yet in force, it is worth checking the draft General Plan before purchasing, as it will soon become the superior document. If the purchase purpose conflicts with the draft General Plan, the chances of completing the project are small.

Differentiating features – the devil is in the details

Properties, regardless of type, have a set of universal features that constitute an important selection criterion. The variation of these features depends on local conditions (e.g. in a small town with buildings no higher than five storeys, you won’t find a 10th-floor apartment with a panoramic view), the purpose of the purchase (for agricultural land, utility access is not a primary value -influencing feature) and individual preferences. The latter are not measurable and cannot be categorised. Local conditions relate to the general location of the property and its technical and functional conditions. The purpose of purchase is the factor that defines the utility of the property in light of all its features. In the area of unbuilt land, three main groups of features may be distinguished, depending on designation: features for agricultural land, land for residential development and land for commercial development. Commercial development is rarely an area of interest for Kowalski, as an investor selects a property to suit specific needs. In case of plots for residential development, the average Kowalski will mainly be guided by access to infrastructure, location depending on preferences (distance from the city centre, woodland, service areas, recreational areas), neighbourhood and the actual condition, which determines the financial input required for the plot to be useful for the purpose intended at the time of purchase. The purchase of development land largely depends on individual preferences; however, the description of the property offered for sale and the properties that have been traded in the real estate price registers (RCN) is limited to a few general pieces of information, such as area, designation (unfortunately in only a small part of the RCN data) or access to local infrastructure (this information is also difficult to find in the RCN in many locations). These sources do not take into account features such as neighbouring uses and the inconveniences associated with them, the impact zones of expressways, land slope or undulation, as well as soil and water conditions, especially in spring. These are only some of the features that undoubtedly affect the decision to purchase a property, yet they are not provided even at the offer stage. The above range of data must be determined independently. In addition, in order to compare the asking price of a property with sale prices in the area, these details must also be established for the plots against which the offered plot will be compared. In case of agricultural land, the set of features that significantly affect value is completely different, although some publications and analyses show attempts to identify features typical of development land in land designated for agriculture. This situation results from the practice of buying agricultural properties in order to transform them into land suitable for development. In that context, looking for features typical of development land in agricultural land makes sense; however, it distorts the perspective and the scope of information that should characterise agricultural land to be used in accordance with its current designation. In addition, asking prices for agricultural land that mention such features as access to utilities, road access or distance from the city centre are higher than for plots offered as typical agricultural land. This gives rise to a new group of properties, colloquially referred to as “agricultural land +”, meaning land that can be transformed and used for a purpose other than its original designation. This group of properties will not only be characterised by higher asking and transaction prices than typical agricultural land, but will also distort market statistics, because formally such a property will still be recorded as agricultural land, but with a price clearly exceeding market trends.

The actual development status – what the eyes doesn’t see

Based on photos in an advertisement, a buyer can roughly estimate how much work is required to achieve the intended purpose of purchase. Many offers present photographs from a bird’s-eye view, which makes it easier to assess tree cover, landform or the location in relation to overhead lines or watercourses. All this allows for a reliable assessment that will affect price negotiations. Obviously, not every aspect will be visible in photographs or even during an inspection. An example is the seasonal water level, which perfectly illustrates that the same plot may be a dream come true in summer, but in early spring may turn into a waterlogged sponge saturated to the limit, making the intended construction project difficult or impossible. If one wishes to compare a property from an offer with properties that have been traded, the task is no longer so simple. The data provided by district authorities do not contain a reliable description of the development state at the time of sale. It is not known, whether the sold plot has a higher price because there are foundations from 30 years ago on the site, invisible in map services, or because before sale it was cleared of shrubs and trees and fenced. More than once it turned out that a property classified in the RCN as unbuilt land was, at the time of sale, developed with a building under construction. The description often did not address this aspect; therefore, statistically, prices of unbuilt land are artificially inflated by incorrect classification. The fact that construction of a building was not completed, should not lead to such a property being classified as unbuilt land. Prices of such properties sometimes do not differ significantly from prices of unbuilt properties with exceptional and attractive features. It is therefore possible to mistakenly include in an analysis a plot with construction already started, which in the records will stand as unbuilt. It will have a high price, while in reality, had it not been for the building under construction, it would not have had exceptional features. The assessment of such a plot will be misleading in terms of its attractiveness because of an unseen “detail” (in the records and in the analysis), namely the ongoing construction. This situation will make the analysis of the profitability and rationality of purchasing a plot from an offer unreliable and overstated.

Summary

Choosing a dream plot is determined by several interrelated factors. The first involves emotions and is based on a first impression. After initial selection comes the stage of proving to oneself that the property is worth the asking price. Before the RCN was opened, this was difficult because finding information on land use, neighbourhood nuisances or soil-water conditions required time and knowledge of where to look and how to interpret the data. Value verification was based on current market asking prices or expert knowledge (appraisals and opinions from professional property appraisers). After the release of the RCN, the burden fell on Kowalski to analyse transactions from the nearest area and, as if that were not enough, to verify the RCN data and supplement them with missing information. What had previously been in the hands of experts, was shifted onto the shoulders of every buyer, regardless of experience and knowledge. The outcome of the interpretation of the analysis depends on personal predispositions and life experience, therefore, it is not an objective process enabling a rational decision to be made.

Agata Wróblewska
Data Quality Officer
Certified Property Valuer (License No. 8247)

A mortgage loan with a periodically fixed interest rate during a cycle of interest rate changes

In recent years, many borrowers have painfully learned how strongly changes in interest rates affect the amount of their instalments. Dynamic decisions of the Monetary Policy Council translated into higher reference rates, such as WIBOR, and consequently into sharp increases in monthly liabilities. The choice of the type of mortgage loan interest rate is no longer solely a cost-related decision, but is becoming an element of household financial risk management. Under such conditions, mortgage loans with a periodically fixed interest rate are attracting growing interest. How do they work in different phases of the interest rate cycle and when can they be a beneficial solution?

What is a mortgage loan with a periodically fixed interest rate?

The mechanism of a periodically fixed interest rate is based on temporarily “freezing” the interest rate for a predetermined period, most often five years, less frequently seven or ten years. During this period, the borrower repays the liability according to a schedule based on an unchanged rate determined at the time the agreement is concluded or at the beginning of a given fixed-rate period. Structurally, the interest rate still consists of the bank’s margin and a market component; however, the latter no longer functions as a variable index and instead takes the form of a fixed value calculated on the basis of market expectations regarding the future level of interest rates.

Differences between a loan with a variable interest rate and one with a periodically fixed interest rate

The basic difference between a loan with a variable interest rate and a loan with a periodically fixed interest rate lies in the method of determining the interest rate over the term of the loan agreement.

In the case of a loan with a variable interest rate, the interest rate depends on two elements: the bank’s fixed margin and the variable reference rate of the interbank market. This means that the amount of the loan instalment may change during the repayment period, both increase and decrease, depending on decisions concerning interest rates.

By contrast, a loan with a periodically fixed interest rate is characterised by the fact that the interest rate remains unchanged for a period specified in the agreement. During this period, the instalment amount is fixed and independent of current interest rate changes. After the fixed-rate period ends, the borrower may choose a new fixed rate for the next period or switch to a variable rate.

The most important consequence of this difference is the level of risk borne by the borrower. In a variable-rate loan, a greater share of the risk associated with changes in interest rates rests with the customer. Meanwhile, a loan with a periodically fixed interest rate allows for a temporary reduction of this risk by guaranteeing an unchanged instalment amount.

Growing interest in loans with a periodically fixed interest rate

With the beginning of the cycle of interest rate increases, there was a noticeable rise in interest in loans with a periodically fixed interest rate. Borrowers began to look for solutions that would allow them to protect themselves against further increases in financing costs.

The greatest intensification of this phenomenon was recorded in the first months of 2022. During this period, the share of loans granted with a periodically fixed interest rate reached its highest level compared with previous quarters. The increase in interest resulted primarily from growing awareness of the risks associated with variable interest rates, as well as the rapid rise in loan instalments observed in households.

CHART 1. INTEREST RATE STRUCTURE BY NUMBER OF GRANTED LOANS: VARIABLE VS. FIXED (IN %)

source: Authors’ own study based on data made available by the banking sector

It is worth emphasising that the increase in interest in the “safer” loan was already visible in the first quarter of 2022, while the largest increase in sales was recorded in the second quarter. In practice, however, a significant portion of these loans was granted on the basis of applications submitted earlier. This means that the mortgage market’s response to changes in monetary policy was partially delayed, which resulted from the fact that the loan granting process itself usually takes from several weeks to even few months.

Why is the difference between fixed and variable loan interest rates decreasing and what does it really mean?

Until recently, the difference between fixed and variable interest rates was clearly greater and represented the price of security. Currently, the market expects that the interest rates set by the National Bank of Poland may still decline in the future, which causes both variable and fixed interest rates to move closer to each other. Additionally, inflation remains at a low, stable level, which means that banks no longer need to add a large risk premium to fixed-rate loans.

It is worth emphasising, however, that the convergence of interest rates does not result from the “goodwill” of banks, but from their own calculations and their desire to hedge risk – banks adjust loan pricing to the anticipated decline in the cost of money in order to maintain profitability regardless of future interest rate changes.

CHART 2. AVERAGE INTEREST RATE ON HOUSING LOANS

source: AMRON-SARFiN Report 4/2025 (https://amron.pl/en/raport/amron-sarfin-report-4-2025/)

Fixed rate – for who it is a good solution?

Fixed interest rates are best suited to people, who value stability and predictability. They are particularly beneficial for households with limited budget flexibility, for which a sudden increase in instalments could lead to serious financial problems.

Fixed interest are also a good solution for people, who plan long term, for example families raising children, who want certainty regarding their expenses in the near future. In such cases, stability often has greater value than potential savings. In times of considerable uncertainty, even with the current declines in interest rates it is worth remembering that the market may change direction from one day to the next.

By contrast, people with a higher tolerance for risk, higher incomes or a more flexible financial situation may prefer variable interest rates, counting on the benefits resulting from interest rate cuts.

Summary

In a cycle of interest rate increases and decreases, a loan with a periodically fixed interest rate is not a “better” or “worse” solution – it is a tool for managing the borrower’s own risk. In a period of rising rates, it acts as protection against a sharp increase in the instalment. In a period of falling rates, it means giving up part of the potential savings in exchange for earlier security. The final choice should depend not only on market forecasts, but above all on the borrower’s individual risk tolerance and financial stability.

Joanna Woźniak
AMRON Maintenance and Development Specialist
SARFiN Data Administrator

AMRON – a quality-driven database

As far as databases used for real estate market analysis are concerned, not only the number of records collected is crucial, but above all the reliability and consistency of data counts the most. From the very beginning, AMRON System has adopted the principle that the value of a database is built on data quality rather than data volume. For this reason, the development of the system and the processes related to data collection are designed in such a way as to minimise the risk of errors and inconsistencies to the greatest possible extent.

From the very beginning of the System’s existence, it was assumed that, as the administrator, we take full responsibility for the quality of the data stored in the database, regardless of how it is sourced. This means that every particular record entered into the System is subject to multi-stage quality control. Data is not entered into the database automatically and without oversight – it is verified both at the moment of entry and at subsequent stages of its functioning within the System.

FIRST: VALIDATIONS

Already at the data entry stage, an extensive validation mechanism is used to eliminate errors. In the new version of the AMRON System, these mechanism has been significantly expanded and divided into three levels.

The first is preliminary validation, performed during the upload of a batch data file into the System. At this stage, the correctness of the file structure and its format are checked. The System verifies, among other things, the consistency of the field layout and the permitted number of records in a single file. The purpose of this validation is to detect technical errors before the actual data processing begins and to ensure the stability and performance of the entire solution. This validation applies only to batch uploads – in the case of individual data entry via the web interface or via API, it is not performed.

The second level consists of first-level validations, which cover all records entered into the System – whether entered individually by a user in a browser, via API or in batches. At this stage, the System checks the basic correctness of the data. It verifies, among others, whether fields are mandatory, whether data types are correct, the permitted number of characters and the formats of individual pieces of information (e.g. masks for specific attributes). In the case of records entered in batches or via API, the correctness of dictionary values is additionally checked – the System verifies, whether a given value belongs to the set of permitted values defined in the System dictionaries.

The most advanced level of control consists of second-level validations. Their purpose is to identify situations, in which the data formally meets all the basic requirements but may indicate a potential substantive error. This applies, for example, to cases, when information in different fields is mutually contradictory or when values significantly deviate from typical parameters for a given type of property. In such situations, the user entering the data must confirm its correctness. Some of these validations may also result in the record being referred for additional approval by a privileged user (i.e. the Central System Administrator). This level also includes mechanisms comparing a new record with records already existing in the database, which makes it possible to detect and eliminate potential duplicates.

SECOND: QUALITY REVIEWS

However, data quality control does not end at the stage of System validations. Each record may be subject to a quality review process and, if any doubts arise, a so-called verification request is created. This is a formal process aimed at checking the correctness of the data and – if necessary – correcting it. In addition, the banks entering data into the System also carry out periodic quality verifications of the data they have entered. As a result, the database is continuously monitored and improved, and potential inaccuracies are systematically eliminated.

THIRD: STANDARDISATION

The scope of mandatory data in the database has been designed in accordance with Recommendation J, which ensures information consistency and its usefulness for real estate market analyses. In the new version of the System – AMRON III, a number of solutions supporting users in the data entry process have also been introduced. One of them is integration with external registers and databases. For example, the “cadastral district” attribute is a dictionary consistent with GUGiK data and after an address is selected, the list of available cadastral districts is automatically narrowed to the selected municipality. The building number entered is verified on the basis of the Address Points Database and postal codes are matched to the indicated location. If a land and mortgage register number is provided, the System automatically indicates the competent land and mortgage register court. Another feature is that records may be automatically supplemented with information (i.e. regarding year of construction, number of storeys in the building, building structure, building density, transport accessibility, surroundings, information on energy efficiency and others) collected in the Buildings Database – a proprietary database of information on buildings in Poland maintained by the AMRON Centre. The automatic retrieval of data from the Buildings Database reduces human error and improves the reliability of records; moreover, users do not have to manually search for and complete many building parameters. The System performs this automatically, which significantly shortens the time needed to enter a record. Additionally, exchange rates may be retrieved automatically depending on the selected currency and transaction date.

The System also uses the official Statistics Poland (GUS) TERYT register. During data entry, the TERYT code is completed automatically on the basis of the TERC, SIMC and ULIC registers, so the user does not have to manually enter the full address path.

ACQUISITION OF DATA FROM RCN AND THEIR QUALITY

Recently, the issue of acquiring data from Real Estate Price Registers (RCN) has also gained particular importance. Following the introduction of new forms of access to this data, it has become possible to download large information packages in GML format, covering transactions from many counties. In one of many tests of this solution, we downloaded data initially covering more than 170 counties. At first glance, such packages might appear to be an ideal data source enabling a rapid increase in the scale of the database. In practice, however, the analysis of the quality of this information proved to be crucial. After converting sample GML files into tabular form (accepted by the AMRON System), it turned out that many records did not contain basic information – for example, the address number of a unit. In addition, the GML files also lacked information on land designation, which is available in data obtained directly from RCN through the traditional route.

Even greater differences became apparent during a detailed analysis of data quality. In one county, the package contained more than 28 thousand transactions. After applying basic quality filters, such as completeness of the ownership share in the property, minimum land area, realistic price per square metre or exclusion of non-standard sources of information, the number of records that could be used dropped to around 5 thousand. This means that nearly 80% of the data was rejected due to insufficient quality or incompleteness.

This example clearly shows why AMRON consistently applies the principle of “quality over quantity”. Although it would be technically possible to quickly increase the number of records in the database through the automatic import of large data packages, in practice this would mean introducing a significant amount of incomplete or questionable information. Instead, data selection procedures are applied that make it possible to retain in the database only those records that meet specific quality standards.

Therefore, in the case of RCN data, in many situations the traditional route of obtaining information is still used, even though it is more time-consuming and often subject to additional limitations, for example regarding the number of records that may be downloaded one-off. However, it makes it possible to obtain more complete data, including full address information and additional attributes important from the point of view of market analysis.

SUMMARY

All the mechanisms described above – from multi-level validations, through integration with public registers, to verification processes – have one common objective: to ensure the highest possible quality of data in the AMRON database. As a result, users of the System can base their analyses on reliable, consistent and thoroughly verified information. Our goal at AMRON is to create a database based on reliable data – a larger number of records matters only when they are of high quality.


Karol Kacprzak
AMRON III Project Manager
Specialist for Analysis and Development of the AMRON System

Clean Transport Zones – do they actually affect air quality in European cities?

At present, an increasing number of large European cities are designating within their boundaries a special areas known as a Clean Transport Zones (CTZ). Within such a zone, only vehicles that meet the relevant exhaust emission standards are permitted to circulate. These standards, referred to as Euro standards, are directly linked to the vehicle’s production date. Vehicles of all powertrain types (petrol, diesel, hybrid, LPG) may enter the zone, provided they meet the required exhaust-emission level. Each city delineates such an area independently – the boundaries of the zone are set by local governments under their own rules. CTZs usually cover up to a few percent of a city’s area, however, the positive effects of their introduction may be felt across the entire city. The primary aim of establishing CTZs is to reduce the level of pollution generated by transport. An additional benefit may also be a reduction in traffic congestion and noise levels. On a European scale, the equivalents of Clean Transport Zones are Low Emission Zones, although there are also ideas and attempts to introduce Zero Emission Zones.

There are currently around 320 Clean Transport Zones operating in Europe. Whether the designation of such areas in a city will have a greater or lesser impact on improving air quality depends on many factors, including:

  • emission limit values,
  • effectiveness of monitoring and enforcement within the zone,
  • the types of vehicles permitted to circulate within the zone,
  • the types of vehicles that used to circulate in the area before the zone was introduced,
  • how high the level of air pollution was prior to the establishment of the zone.

On a European scale, it is possible to identify several Clean Transport Zones whose effects are best described and monitored.

London

In London, one of the most extensive zone systems in Europe has been developed. The designated areas have changed their boundaries several times, as the local authority sought to maximise the positive effect of introducing the zone. As a result, the Ultra Low Emission Zone has been in operation across the whole of London since 2023. The city’s core is also covered by a congestion charge (a daily fee for entering).

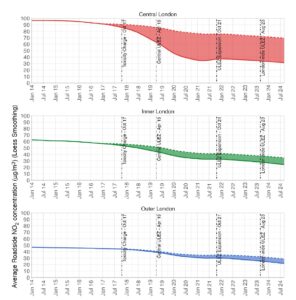
London’s city authorities monitor air quality and prepare periodic reports on the zone’s effectiveness. The latest report[1] (as of March 2025) includes, among others, the following conclusions:

  • Nitrogen dioxide concentrations fell by 27% across London. Compared with 2019, NO2 concentrations in the city centre fell by as much as 54%; in the area referred to as Inner London they fell by 29%, while on the outskirts they fell by 24%.
  • The expansion of the ULEZ also had a positive impact on PM2.5 emissions. Compared with 2019, these emissions on the outskirts were lower by as much as 31% (compared with the “without the ULEZ zone” scenario).
  • Since the designation of the ULEZ, air quality has improved at as many as 99% of air-quality monitoring points. In addition, it was noted that the pace of improvement is significantly faster than in the rest of England.
  • In the period 2019-2024, the ULEZ also contributed to a reduction in carbon dioxide emissions by 813 thousand tonnes.

The charts below show how nitrogen oxides (NO2) concentrations in London have changed over the years, along with successive stages of introducing the Low Emission Zone.

FIGURE 1. CHANGES IN NO2 POLLUTION CONCENTRATIONS IN LONDON, 2014-2024

source: https://www.london.gov.uk/sites/default/files/2025-03/London-wide%20ULEZ%20One%20Year%20Report_Mar2025.pdf (accessed: 18 February 2026)

The Clean Transport Zone in London is in operation and is regularly monitored, optimised and modified, which enables the city authorities to achieve very good results reflected in a tangible improvement in air quality and a reduction in pollution emitted by transport.

Paris

The Paris clean transport zone (known as ZCR – Zone à Circulation Restreinte) has been in operation since 2019. Its boundaries are approximately defined by the A86 motorway. Entry to the zone is possible if the vehicle has a Crit’Air sticker. This solution has been introduced nationwide, which means that the same Crit’Air sticker designation entitles vehicles to enter cities such as Marseille, Lyon, Nice, Strasbourg and others.

A report prepared by AIRPARIF (the Paris regional air observatory)[2] shows that:

  • in 2012–2022, residents’ exposure to nitrogen dioxide (NO2) pollution in Paris decreased by 40%;
  • over the same period, the local community was also exposed to significantly lower levels of PM2.5 particulate pollution – by approx. 28%;
  • CO2 emissions from traffic congestion fell by 35%.

These results were driven primarily by the direct consequences of introducing the clean transport zone: modernisation of the vehicle fleet and a reduction in congestion in the city, during which the largest amounts of pollutants are released.

Amsterdam

Amsterdam’s Clean Transport Zone was established in 2019 concurrently with the adoption of the “Clean Air Plan”. The city began by introducing a low-emission zone but, gradually and in line with the assumptions of a detailed plan, it is working, among other things, towards creating a zero-emission zone for public transport. The CTZ area (referred to as the Milieuzone) covers the area inside the A10 ring road. The time horizon for achieving full zero-emission status has been set for 2030.

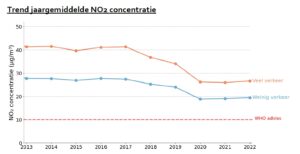
The 2022 Air Quality Results Report published by GGD Amsterdam[3] shows key trends resulting from the introduction of the zone, as presented in the charts below.

FIGURE 2. Changes in NO2 and PM2.5 pollution concentrations in Amsterdam, 2013-2022

source: https://openresearch.amsterdam/image/2023/6/28/jaarrapportage_luchtmeetnet_2022_ggd.pdf (accessed: 18 February 2026)

The report emphasises that although pollution levels are significantly lower than in previous years, after the end of COVID-related restrictions and the renewed increase in car traffic, the decline in NO2 has slowed, which necessitates introducing subsequent stages of implementing zero-emission zones.

Poland

Currently, there are two Clean Transport Zones in Poland: in Warsaw (since July 1, 2024) and in Cracow (since January 1, 2026). Warsaw has covered approx. 7% of the city’s area with the zone (37 km2), while in Cracow it is more than half of the city’s area. The next Polish city planning to implement a CTZ is Wroclaw. Since zones in Poland have been operating for a relatively short time, there are still no data and analyses regarding their functioning and the measurable effects achieved.

Summary

Clean Transport Zones are a solution with positive effects, in particular for residents and local communities of individual cities. Restrictions imposed within the zones contribute to reducing air pollution generated by transport. It is worth remembering, however, that the designation of a zone is neither a one-off nor a uniform solution, as shown by examples from European cities. To maximise the positive impact, it is necessary to continuously monitor the zone’s operation and adjust the initially adopted assumptions (e.g. allow/ exclude specific vehicle types, expand/ reduce the territorial scope of the zone). Accordingly, over the years various trends in the operation of CTZs can be observed – some cities tighten regulations, while others lift zones after achieving specific targets. Although the introduction of CTZs certainly poses difficulties for part of the population, their primary objective is to safeguard residents’ health and air quality in cities. The effects of this element of urban policy depend primarily on the scale, duration and consistent monitoring and enforcement of the adopted assumptions. Implementing Clean Transport Zones in an informed and precisely planned manner can certainly have a direct and measurable impact on improving air quality in large cities, as evidenced, among others, by results presented in air-quality change reports prepared in individual cities.

Barbara Mariańska
AMRON System Maintenance and Development Specialist


[1] https://www.london.gov.uk/sites/default/files/2025-03/London-wide%20ULEZ%20One%20Year%20Report_Mar2025.pdf (accessed: 18.02.2026 r.)

[2] https://www.airparif.fr/sites/default/files/document_publication/PR%20-%20Paris%202012-2022.pdf#:~:text=They%20have%20resulted%20in%20an%20average%20reduction,road%20traffic%20have%20also%20fallen%20by%2035%25 (accessed: 18.02.2026 r.)

[3] https://openresearch.amsterdam/image/2023/6/28/jaarrapportage_luchtmeetnet_2022_ggd.pdf (accessed: 18.02.2026 r.)


‘Concrete gold’ in 2026: is real estate still a safe harbour or already an overvalued anchor?

The beginning of 2026 on the Polish real estate market is a moment of tension between two forces of rarely seen intensity. On one hand, we are observing record-high housing prices in major urban areas, which should be considered as precaution alert. On the other, an unprecedented scale of liquid household savings. The amount held in Poles’ current accounts has exceeded one trillion zlotys, and a further more than PLN 400 billion is held in time deposits. This is the picture of a society that, despite the inflationary turbulence of recent years, still has substantial purchasing power.

The question increasingly asked by both investors and ordinary buyers is: will this capital, encouraged by the interest-rate cuts of 2025, flow back into the real estate market, fulfilling the national “dream of concrete”? Or has an apartment ceased to be the obvious investment choice and begun to resemble an anchor that limits financial flexibility?

The end of a one-way street

For more than a decade, the Polish housing market resembled a straight road leading to wealth. Low interest rates, limited supply and dynamic price growth meant that nearly every purchase decision ended with success. An apartment was not only a consumer good, but also an almost automatic policy protecting capital against inflation. However, 2026 brings a reality check for this model. Although the rate-cut cycle has become a fact, apartment prices remain very high, close to historical peaks. In these conditions, real estate ceases to be the default choice and increasingly becomes an asset that requires cool-headed calculation, realistic assumptions and a long- time horizon.

A recovery without euphoria

December 2025 brought a clear revival on the primary market. Instead of a seasonal slowdown, there was an increase in the number of apartments launched for sale and transaction volumes almost matched new supply. This was a response to improved credit availability, not a ‘random spike’. At the same time, there was no phenomenon of mass buying panic, the so-called ‘FOMO’ (Fear of Missing Out) known from earlier years. Instead of emotional decisions, we observed a gradual return of demand based on calculation. The market’s psychological foundation remains strong, however, according to the report “Barometer of Poles’ Investment Readiness 2025”, owning real estate still ranks first in the hierarchy of Poles’ investment aspirations. This gives demand a structural rather than purely cyclical character.

The paradox of cheap money

One of the biggest myths of today’s market is the belief that ‘it pays off to buy now because credit is cheap’. A simulation of purchasing a 50-square-metre apartment in a large urban area proves how illusory this assumption is.

TABLE 1: COMPARISON OF PURCHASE COSTS (50 SQ. M. APARTMENT)

Parameter Purchase at peak rates (2023) Purchase after cuts (2026) Change
Transaction price per sq. m. PLN 12 500 PLN 15 500 +24,0%
Property value PLN 625 000 PLN 775 000 +P LN 150 000
Required down payment (20%) PLN 125 000 PLN 155 000 + PLN 30 000
Loan interest rate 8.50% 5.70% -2.8 pp
Loan amount PLN 500 000 PLN 620 000 + PLN 120 000
Estimated monthly instalment
(25 years)
approx. PLN 4 230 approx. PLN 3 920 –      PLN 310

source: author’s own calculations

In 2026, a buyer pays approx. PLN 150 000 more for a comparable apartment than a buyer in 2023. The monthly instalment, lower by approx. PLN 300, comes at the cost of a much higher nominal debt and the need to put up an additional PLN 30 000 upfront. The entry barrier is not falling – in many cases, it is actually rising. This effectively dampens impulsiveness and makes credit a tool of optimization rather than an emotional trigger.

Demand is returning, but it has changed in nature

Demand that was frozen during the period of high interest rates is gradually returning in 2026. However, it is not spreading evenly across the country. It is recovering the fastest in locations, where fundamentals remain strong: in large cities, in locations with good transport accessibility and functional floor areas. The character of demand has changed markedly. Purchases driven by genuine housing needs dominate, rather than speculation. Customers are more selective and purchase decisions are less often made under time pressure or fear of a ‘running-away price’. As a result, the differences between well-designed projects and those created during the boom are becoming increasingly visible. The market rewards quality, location and functionality, not merely the fact of having an offer.

Supply and ‘price stickiness’

On the supply side, the situation appears paradoxical. The number of available apartments remains high, which in a classic framework should put downward pressure on prices. Yet in most locations, prices remain stable. High development costs and developers’ cautious policies mean the market has entered a phase of so-called ‘price stickiness’. Instead of corrections, we more often observe negotiations, flexibility in sales terms and non-price bonuses (e.g., a garage included in the price). This is an environment favourable for buyers, but it does not mean a cheap market. Apartment prices in 2026 are rather high, but stable and predictable.

The savings potential

It is worth remembering that price stabilization in nominal terms does not automatically mean real gains. In many cities, the market is still compensating for inflation from previous years and the real rate of return on housing remains low. This is not a speculative bubble environment, but it is also far from quick and easy profits market. Real estate is not an offensive asset any more, not as much as it used to be, but more often it becomes a capital-protection tool, requiring a long horizon and realistic expectations.

The trillion zlotys accumulated in Poles’ accounts is highly impressive. The last time such a strong propensity to build up funds was recorded in 2019, which foreshadowed a period of very intense investment purchases. Today, however, the situation is different. Inflation has returned close to target and deposits together with treasury bonds offer positive rates of return. The pressure to ‘run from cash’, characteristic of 2022–2023, has clearly weakened.

In addition, investment demand collides with the hard mathematics of yields. The rental market, after a period of dynamic rent increases, has entered a phase of stabilization offering predictable but moderate income, increasingly resembling a long-term income instrument rather than a source of spectacular gains.

Where did FOMO go?

Calmness in sales offices stems from three key psychological and behavioural factors. First, the erosion of trust in state intervention on the housing market, shaped by experiences with the ‘Safe Loan 2%’ programme and announcements of further subsidies – citizens has stopped believing in quick, free gifts from the state. Buyers have learned that subsidy announcements most often end with a sudden jump in real estate prices that cancels out the benefit of the subsidy. Second, a real alternative in the form of bonds and deposits. Despite rate cuts, treasury bonds (especially those linked to inflation from previous years) are still working in Poles’ portfolios. The sense of security provided by ‘clean money’ in a bank sub-account wins over the prospect of dealing with tenants and renovations. Third, price fatigue, i.e., Poles have reached a psychological threshold of price acceptance and PLN 20 000 per one square metre for a mass-market standard in a large city has stopped shocking and started to discourage.

The market has entered a ‘wait-and-see’ phase, resulting from the simple inability to finance a purchase without drastically lowering one’s standard of living. However, this may change soon. In December, developers launched a record 5.3 thousand apartments for sale and obtained construction permits for 20 thousand apartments, which can be interpreted as preparation for an offensive. Developers are building up their offer, expecting that further rate cuts combined with wage growth will break the psychological barrier. Then part of the capital may move back toward real estate. And it is precisely this moment, when the risk appears that real estate – purchased under pressure – will become an anchor.

Real estate as an anchor

An excessively high purchase price causes real estate to lose its defensive characteristics. At current valuations, the profit-to-risk ratio becomes less attractive, especially if we take into account the following factors:

  • Returns: at current purchase prices, net rental yields in large cities hover around 3.5–4.5%. This level is comparable to safe financial instruments that require no management, renovations or vacancy risk. Real estate bought at peak valuation ceases to be an obvious investment alternative.
  • Liquidity trap: shares can be sold in 3 seconds. Bonds in 2 days. An apartment in 2026 takes an average of 6-9 months to sell, unless we want to cut the price drastically. In the era of geopolitical uncertainty, freezing several million zlotys in concrete can be a strategic mistake.
  • ‘Energy vampires’: the EPBD directive means that environmental awareness ceases to be a hobby and becomes a financial obligation. Apartments in old tenement houses or large-panel blocks that have not undergone thermal retrofitting begin to be valued with an ‘energy discount’. The cost of modernizing a unit may soon exceed the potential gains from its value appreciation.
  • Demographics: this is not a problem that will hit tomorrow – in smaller cities it is already a problem today. The concentration of demand in the five largest metropolitan areas means that investments in smaller towns become a trap of not having a tenant.

In such conditions, concrete stops being ‘gold’ by definition and starts being an asset that requires active management and readiness for a long time horizon.

Where does real estate still make sense?

This does not mean that apartments as investments are written off. Real estate continues to serve as a hard asset and capital protection in the long term. It wins, however, only in specific segments: well-located, aligned with real demographic needs, with yields clearly exceeding safe alternatives. Scale, professionalization and resilience to cycle fluctuations are gaining importance.

Scenarios for 2026 – 2028

The most likely scenario remains one of moderate stagnation: transaction prices stand still or rise by 2-3% annually (below inflation), the market becomes a buyer’s market (there is time to negotiate, view and choose ‘gems’) and profits are made by those, who can select opportunities. A scenario of a rapid return of FOMO would require a combination of very low rates and strong wage growth. Then capital from deposits would move en masse into the market, creating the last major growth wave of this decade. A price correction, in turn, remains possible only in the event of a strong external shock (geopolitics) – leveraged investors would be forced to sell off, which could reduce prices by 10-15%. For those buying at the peak in 2024/25, this would mean losing their entire downpayment.

Summary

The housing market in Poland in 2026 is neither in a bubble phase nor in a collapse phase. It is a mature, stable market and clearly more demanding than in previous cycles. ‘Concrete gold’ has not ceased to exist, but it no longer shines equally for everyone. It remains a safe haven only for those, who can realistically assess the cost of capital, yields and liquidity risk. For others, it may become an anchor – a burden limiting financial flexibility for years. In 2026, the true luxury is not owning many apartments. It is financial liquidity and peace of mind – something that concrete, bought at any price, can easily take away.

Agnieszka Pilcicka
Senior Real Estate Market Analyst

ESG – a regulatory imperative and a new dimension of risk management

Sustainable development has ceased to be an element of financial institutions’ image strategies. ESG has become firmly embedded in the language of regulation, supervision and risk management, emerging as one of the key factors influencing banks’ stability, access to capital and the assessment of portfolio quality. What only a few years ago functioned as an area of voluntary commitments and good practices, now constitutes one of the foundations of the banking sector’s operation in the European Union. ESG has ceased to be an add-on to strategy – it has become an integral part of it.

What ESG is and why it matters for the financial sector

The ESG acronym refers to three interrelated areas used to assess business and financial activity. E stands for environmental factors, including climate impact, energy consumption, greenhouse gas emissions, buildings’ energy efficiency and the exposure of assets to physical and transition risks. S, the social dimension, includes, among others, the quality and safety of the surrounding environment, access to public infrastructure, the impact of investments on local communities, as well as living and working conditions. G represents corporate governance, understood as the way an organisation is managed, the transparency of decision-making processes, the quality of internal controls and the ability to identify and manage risk. In banking, all of these elements translate directly into financial stability, client credibility and the long-term value of collateral.

The EU regulatory revolution as a turning point

A turning point for the banking sector was the intensification of legislative action at the European Union level. The EU Taxonomy, the SFDR Regulation and the CSRD Directive have clearly shifted ESG from the realm of good practice into the sphere of hard legal obligations. Banks have been required to report not only their own impact on the environment and society, but also the risks and exposures arising from clients’ financed activities. This means the need to analyse entire credit and investment portfolios in terms of alignment with climate objectives and sustainable development standards. Complementing this regulatory landscape is the Omnibus Package, the purpose of which is not to reduce ESG requirements, but to organise and harmonise them. The emphasis has been placed on regulatory coherence, comparability of indicators and the quality of the data used in reporting. For banks, this means moving away from fragmented, manual processes and building unified, resilient information systems capable of supporting both supervisory requirements and management needs.

ESG as an integral part of risk management

In this context, ESG has ceased to be solely a reporting area and has become an integral element of risk management. Climate, environmental and social risks are increasingly materialising within classic banking risk categories – credit, market and operational. ESG risk on the client side, in practice, becomes the bank’s risk, affecting creditworthiness, collateral values and long-term portfolio stability.

Real estate and ESG data

Within banks’ ESG activities, the real estate market has gained particular importance, as it is one of the largest components of credit portfolios, while also being one of the key sources of energy consumption and greenhouse gas emissions in the economy. Real estate largely determines the environmental profile of a bank’s portfolio and its alignment with the European Union’s climate objectives, which in practice means the need to systematically obtain and integrate data on buildings’ energy efficiency, technical characteristics, functional standard and exposure to physical and transition climate risks. This information is necessary not only for reporting alignment with the EU Taxonomy or calculating financed emissions, but also for a realistic assessment of the long-term value of credit collateral, because banks must now take into account the risk of value decline for energy-inefficient properties, the costs of future upgrades and the impact of regulatory changes on asset liquidity and attractiveness.

At the same time, one of the greatest challenges of the ESG transformation remains the quality and availability of data, especially with regard to older property stock and historical portfolios, which the Omnibus clearly identifies as a key element in assessing the credibility of reporting, promoting an approach based on a smaller number of precisely defined, comparable indicators and the growing role of specialised external data sources.

The ESG report prepared by the AMRON Centre as a response to banks’ needs

A response to these needs is the ESG report developed by the AMRON Centre, comprising 46 attributes dedicated to residential buildings in Poland. The scope of the report was preceded by a needs assessment of the banking sector, which clearly indicated demand for reliable data on environmental risks and the quality of the property’s surroundings. The report provides standardised, comparable and auditable information on all residential buildings in Poland, covering both the building itself and its immediate surroundings. The collected data include, among others, energy efficiency, CO₂ emissions, heating sources, sustainable construction certificates and the availability of social and transport infrastructure. They are complemented by information on potential nuisances and environmental risks. The entire solution has been designed so that it can be used directly in banks’ reporting, analytical and decision-making processes.

The use of ESG data in the banking and financial sector includes, among others:

  • assessing the exposure of the real estate portfolio to climate and environmental risks,
  • identifying properties eligible for green financing,
  • supporting compliance processes with regulatory requirements such as the EU Taxonomy, CSRD or EBA guidelines,
  • building credit risk assessment models that incorporate ESG factors.

ESG as a competitive advantage for the financial sector

Under conditions of growing regulatory pressure, ESG ceases to be solely a cost of compliance and becomes a lasting element of banking’s regulatory and management landscape. For financial institutions, this means not only the need to meet supervisory requirements, but above all the opportunity to improve risk management, build stakeholder trust and develop sustainable financial products. Banks that already invest in data quality and the integration of ESG factors into decision-making processes gain a tangible competitive advantage and greater balance-sheet resilience over the long term. In this context, access to reliable, up-to-date and comparable ESG information ceases to be support and becomes a condition for the effective and stable functioning of the financial sector in the years ahead.

Klaudia Jastrzębska
Buildings Database Project Coordinator

Poland – an European housing market perspective

The European housing market is a complex organism, responding to shared impulses – decisions of the European Central Bank, shifts in inflation, global economic crises or demographic trends, yet in practice it remains a mosaic of several dozen highly diverse national markets. Differences between them are visible not only in price levels and rent rates, but also in investor activity and housing affordability. These disparities stem from a range of factors, the most obvious of which is the wealth of societies. High housing prices in countries such as Luxembourg, Switzerland, Denmark or the Netherlands are not merely the result of speculation or limited supply – above all, they reflect high wages and stable demand. In these countries, housing is something society can afford, even if purchasing it requires a mortgage spanning several decades. By contrast, in South-Eastern Europe, where incomes are much lower, housing prices are also lower in absolute terms, yet homes remain difficult to access.

Income differences, of course, do not explain everything. Regulatory and institutional factors are extremely important as well. European countries apply very different approaches to residential real estate markets. In some states the market is strongly regulated, particularly with regard to renting, tenant protection and rent controls. Germany and Austria are examples: while regulations stabilize the market, they can also limit investors’ willingness to build new housing. In other countries, such as Ireland or Spain, regulations are more liberal, which supports investment but increases the risk of rapid rises in prices and rents.

Central and Eastern European countries operated for decades under centrally planned economic systems, where a real estate market practically did not exist and housing was allocated through administrative decisions. The political and economic transformation of the 1990s created a market almost from scratch, often without adequate regulations, institutions or experience. As a result, many states in the region are still catching up in terms of infrastructure, urban planning and institutional frameworks, while a high share of owner-occupied housing, a low level of institutional rental supply and a strong role of individual investors remain characteristic features of those markets. Such conditions make them much more prone to sharp price increases during boom periods and more sensitive to changes in credit policy.

An important factor differentiating European housing markets is demographic structure. Ageing societies in Western and Southern Europe have different housing needs than the younger populations of Central and Eastern Europe. In countries with a high share of elderly people, demand for new housing is weaker and the market more often focuses on renovating the existing stock. Conversely, where the population is growing or where migration to cities is intense, demand pressure is much stronger. Internal and international migration is today one of the most important drivers of regional differences. Large cities attract young people, students and foreign workers, which pushes up prices and rents, while smaller towns and peripheral regions often struggle with depopulation and price stagnation. This is closely linked to urbanisation – another element that significantly affects European housing markets. In countries such as France, the United Kingdom or Spain, population concentration in a few major metropolitan areas is very high, creating enormous pressure on the housing markets of Paris, London or Madrid. In countries with more polycentric settlement structure, such as Germany or Italy, demand is distributed more evenly, limiting extreme price growth in individual cities. This helps explain why Munich, Hamburg or Frankfurt are expensive, but price differences between them and other major German cities are not as dramatic as in France.

When listing the most expensive European capitals, one cannot ignore the role of foreign investors. Housing in many European cities has become a global investment asset. International capital flows into London, Paris, Barcelona or Lisbon, treating real estate as a safe haven. This phenomenon affects Central and Eastern European markets to a much smaller extent, although in Poland’s largest cities a significant inflow of foreign capital during the 2006 – 2008 boom was clearly observed. External capital increases competition for a limited number of homes, raises prices and worsens availability for local residents.

Another factor differentiating housing markets is the role of tourism and short-term rentals. In cities such as Barcelona, Lisbon, Venice or Dubrovnik, a significant share of the housing stock has been converted into short-term rental apartments. This has reduced the supply of homes available to residents and contributed to rising prices and rents. In response, many cities have introduced regulations limiting this segment of the market, but their effectiveness varies. In countries, where tourism plays a smaller role, this factor is far less important, showing how local conditions can shape market dynamics.

Finally, differences between housing markets stem from varying social expectations of housing as a good. In some countries, housing is primarily a place to live, while in others it is a key element of wealth building and financial security. Where real estate is treated as a long-term investment, demand is more resistant to economic fluctuations and prices rise faster. Where renting and mobility play a larger role, the market is more flexible and less prone to sudden surges.

So what are the real differences between the housing markets of European countries and cities? To answer this question, it is worth looking at the Deloitte Property Index report. The report is based on data from local Deloitte offices and official national sources. As a result, the analyses cover not only general trends, but also local markets and the comparison includes thirty countries and more than seventy of Europe’s largest cities.

One of the key elements of the report is an analysis of construction intensity, i.e. the number of completed homes per 1 000 inhabitants. In 2024, the clear leader in this area was Turkey, where nearly seven homes per 1 000 inhabitants were delivered (6.85). This result was almost twice as high as the average across the surveyed countries, which stood at 3.61. Interestingly, the next places were taken by Ireland (5.62) and Poland (5.33), which also maintained strong momentum in housing construction, driven by population growth and ongoing urbanisation. Israel recorded the same developer output ratio as Poland. At the other end of the ranking are Bosnia and Herzegovina, Hungary and Spain. In all of these countries, less than two dwellings per 1 000 inhabitants were completed during the period – 1.04, 1.39, and 1.78 respectively.

In absolute numbers, Turkey also ranked first, with nearly 587 000 homes completed in a single year. That is more than 250 000 more than second-placed France (330.4k) and more than twice as many as Germany (252.0k). Poland, with nearly 200 000 completed homes, ranks fourth, ahead of the United Kingdom by 46 000 homes. The lowest construction volumes were recorded in Bosnia and Herzegovina – 3 400 new homes, as well as in Slovenia – 5,100. Interestingly, when viewed against earlier years, Bosnia and Herzegovina was the country with the strongest growth in housing construction. The year-on-year increase in completed homes between 2023 and 2024 amounted to 17.6%.

A comparison of housing prices across European countries also shows a very high level of market diversity. On one hand, there are countries with exceptionally high prices, led by Luxembourg, where the average price of a new home exceeded EUR 8.7k per a square metre. Prices are only slightly lower in Israel, the United Kingdom, Austria and Portugal, where they are close to EUR 5k per a square metre. Interestingly, this group also includes the Czech Republic, where the average price reached  EUR 5 030 per square metre – clearly higher than in countries such as Germany or the Netherlands. On the other hand, there are South-Eastern European countries such as Turkey or Bosnia and Herzegovina, where prices do not exceed EUR 1 500 per a square metre.

Despite the record growth dynamics at the level of 19.3% annual increase, the average housing price in Poland was clearly lower than in the most expensive European countries, reaching EUR 2 792 per a square metre, slightly above the average price recorded in Italy (EUR 2 741). This result places Poland roughly in the middle of the European ranking. However, what clearly sets Poland apart from most markets, is the pace of price growth. According to the report, Poland recorded the highest price increase among all surveyed countries – 19.3% year on year. This growth resulted from several overlapping factors: strong demand stimulated by a loan programme supporting the purchase of a first home (“2% Safe Mortgage”), insufficient housing supply in the largest cities and a noticeable appreciation of the Polish zloty against the euro, which raised prices when expressed in the European currency. Poland’s position in the European real estate market is therefore quite specific – it combines rapidly rising prices with a still relatively low price level compared with Western Europe.

AVERAGE HOUSING PRICE GROWTH (2024)

source: author’s own elaboration based on the Deloitte Property Index 

At the city level, the most expensive European capitals turned out to be Luxembourg and Paris, where average prices exceed the threshold of EUR 10 000 per a square metre. In Amsterdam, Inner London and Jerusalem, prices were slightly above EUR 8 000 per a square metre. The cheapest capital included in the study was Ankara, where a square metre of a new apartment can be purchased for approx. EUR 1 000. It should be noted, however, that this result was largely driven by a significant depreciation of the Turkish lira against the euro. Among European capitals, the lowest housing prices were recorded in Bucharest (EUR 1 757/sqm.) and Sarajevo (EUR 1 823/sqm.).

AVERAGE PRICE PER SQUARE METRE OF HOUSING IN EUROPEAN CAPITALS (AND ANKARA AND JERUSALEM)

source: author’s own elaboration based on the Deloitte Property Index

In most cases, capitals are also the most expensive cities on national housing markets. There are, however, exceptions to this rule. The most expensive German city included in the report was Munich, where the average price per square metre reached EUR 10 800 (i.e. by EUR 3 600 more than in Berlin). Housing prices in Barcelona were the highest in Spain (EUR 7 859 per square metre), while the highest average price per square metre in the entire ranking was recorded in Tel Aviv – an impressive EUR 13 970.

In the ranking of annual price growth across the surveyed city markets, a strong Polish accent appears once again. The city with the highest increase in the period analysed was Cracow, where prices rose by more than 28%. Authors of the report attribute this increase to strong demand and simultaneous limited supply, as well as the impact of the programme supporting the purchase of a first home. In Jerusalem, price growth exceeded 25%, driven primarily by high demand. In Albania, rising prices in Tirana and Vlorë result from a major inflow of foreign investors and the development of the tourism sector, which strengthens demand for housing both as an investment and as second homes. Several cities also recorded clear price declines, with the deepest drops observed in Turkey, especially in Izmir and Ankara. This was influenced by high interest rates and reduced credit availability, which weakened domestic buyers’ demand, as well as by changes in the exchange rate of the lira.

Housing affordability across individual cities is also very interesting. The report uses an indicator showing how many average annual salaries are needed to purchase a 70-square-metre apartment. The lowest affordability among the analysed cities was recorded in Amsterdam, where more than fifteen annual salaries were required for this purpose. A similar situation was observed in Athens and Prague. In many other Central European cities like Brno, Košice, Ljubljana or Budapest, buying an apartment requires nine to twelve average annual salaries. This group also includes Warsaw, where purchasing the model apartment would require 9.7 average annual salaries, as well as Wroclaw and Cracow (both at 9.3). The most affordable Polish city included in the report is Katowice, where the model apartment requires 7.1 average annual salaries. Across Europe, the most affordable markets turn out to be Scandinavian and British cities with relatively high wages, such as Odense, Aarhus or Manchester, where purchasing a 70-square-metre apartment requires only five to six annual salaries. The ranking is closed by Turin with a result of 4.9.

The most interesting aspect of the overall picture, however, lies in the conclusions that emerge from data on prices, supply and financing costs. In many countries, housing shortages persist, especially in large cities that attract residents thanks to jobs, education and services. High prices do not deter buyers, but they do change behaviour: the importance of long-term renting is growing, as is institutional rental housing, which in many countries is increasingly seen as an important market segment. Affordability will not improve significantly until construction activity increases and wages begin to rise faster than the cost of living and land prices. Importantly, many countries are introducing regulatory measures: restricting short-term rentals, offering incentives for social housing construction and reforming spatial planning. These actions will not solve all problems, however investments in infrastructure, demographic structure, labour migration and the broader macroeconomic situation also play a major role. Europe’s housing market is therefore a mosaic shaped by a set of historical, economic and cultural conditions. Differences between countries and cities are not a temporary phenomenon, but the result of long-term processes. Although Europe is currently facing similar challenges: housing shortages, rising living costs, and urbanisation pressure, responses to these problems will certainly differ from country to country. Each market will react in line with its structure, history and institutions.

Jerzy Ptaszyński
Research and Market Service Director

Cards on the table: how the year 2025 ended the age of secrecy on Polish residential market

The year 2025 has redefined the Polish residential market by introducing far-reaching transparency mechanisms. It is an unprecedented moment, when after years of lack of transparency, Polish lawmakers made this sector more translucent. This unparalleled level of openness is the result of not one, but three key pieces of legislation, which, in just a few months, have fundamentally reorganised the rules of data accessibility. Yet, revealing the data is only half of the success – genuine “total transparency” requires more than free access: it requires competence.

For many years, the Polish primary market was characterised by significant information asymmetry that favoured developers. A widespread problem was the strategy of not quoting the offer prices directly. To obtain information about the price, a potential buyer had to call, ask or arrange a meeting at the sales office – a deliberate mechanism for building informational advantage.

At the same time, access to transaction prices – essential for objective verification of the market value of a property – was limited. Data from the Real Estate Price Registers (RCN) were subject to fees and their disclosure was inconsistent, which hindered large-scale analytics and well-informed purchase decisions.

The year 2025 has brought a structural change by simultaneously strengthening transparency on two key levels:

  1. offer side – mandatory disclosure of offer prices on the primary market, including full price history;
  2. transaction side – abolition of fees for access to prices registers and the launching the government Residential Transactions Data Portal (DOM), which liberalises access to data on transaction prices.

With offer prices becoming public and transaction data being opened up, the market is moving from a model based on secrecy to full verifiability. This is a real source of power for buyers, but also a major challenge for the entire sector, which must adapt to the new reality.

Transparency of offer prices

The amendment to the Act on Protection of the Rights of a Buyer of a Residential Unit or Single-Family House and the Developer Guarantee Fund (the so-called “Developer Act”), which entered into force in stages starting from July 11, 2025, has radically increased transparency on the primary market by imposing on developers a strict obligation to publish complete and reliable information on each project. These provisions were introduced gradually: at first they covered new projects started after the Act’s entry into force, and from September 11, 2025 the obligation to disclose prices has applied to all apartments and houses offered for sale, regardless of the date when sales began.

This is the end of empty listings and negotiating in a vacuum. Developers now have a clearly defined list of information that they must disclose on their dedicated websites, namely:

  • the price per square metre of usable floor area and the full (gross) price for each residential unit or single-family house and for ancillary premises (parking space, storage unit),
  • all other monetary consideration that the buyer is required to pay to the developer, which aims at eliminating hidden costs that previously often surfaced only in the final stages of the transaction,
  • the price history of a given unit – the biggest change in the developer – buyer relationship. A potential buyer can now verify the developer’s pricing policy, which significantly strengthens the buyer’s negotiating position and protects against price manipulation.

The obligation to disclose offer prices significantly increases transparency and provides greater consumer protection. The new regulations have the potential to limit developers’ tendency to raise prices frequently and sharply. Public prices eliminate the possibility of differentiating prices based on a subjective assessment of the customer (for example, their market awareness or urgency to buy) – a practice regarded as unfair. Potential buyers gain the ability to easily compare offers, which shortens the property search process and reduces the need to contact the sales office just to find out the starting price. As a result, when price differences between projects are small, non-financial attributes, such as location, infrastructure or access to services become more important in the purchasing decision.

However, price transparency is not without its downsides. First, a client, who sees a high starting price, may decide not to get in touch at all, losing the opportunity to negotiate a discount or additional benefits directly. Second, the regulations do not define a single mandatory standard for presenting data. The client still has to analyse individual offers on his own, which is time-consuming and requires considerable effort. And third, full visibility of competitors’ price lists makes it easier for developers to monitor the market, which may lead to informal alignment of offers and, in some segments with limited supply, may paradoxically weaken competitive pressure and foster price increases.

Contrary to concerns articulated by some parts of the industry, the entry into force of the price transparency provisions in July and their extension in September 2025 did not trigger sudden, sharp changes in average offer prices. In most of the analysed cities, only small downward adjustments in offer prices of between 1% and 3% were recorded. This was not a direct effect of the Act itself, but rather of accelerated, preventive standardisation of price lists by developers, who wanted to avoid chaos and accusations of unfair practices once their prices became fully public.

Interestingly, this breakthrough in transparency coincided with a revival in demand in the third quarter of 2025, driven, among other factors, by a cycle of interest rate cuts. This means that growing demand is no longer “deaf” to prices. Clients with access to full price lists and transaction data are radically better informed, which has the potential to discipline the pace of price growth even in an environment of rising interest in buying homes.

Free RCN data

While price transparency is a revolution for the primary market, liberalising access to RCN data is a revolution for all market participants. The true market value of real estate is shown only by the transaction price – that is, how much was actually paid.

The amendment to the Geodetic and Cartographic Law, signed by the President on November 4, 2025, fully abolishes fees for the use of transaction data collected in county Real Estate Price Registers (RCN). Although it will not enter into force until February 12 next year, this change is a promise that the most valuable market data will become a universal, free public good. Removing fees is a change of fundamental importance. The previous model, based on paid access (with a fee for each transaction), limited the widespread use of these data to financial institutions, property valuers and professional analysts.

However, it must be remembered that RCN data does not always fully reflect the current market situation due to significant delays in entering data into the IT systems. Several months may pass between the date of signing the notarial deed and the moment this information is made available in the RCN. In addition, the registers do not store data from development agreements and prices from final transfer-of-ownership contracts on the primary market are the result of negotiations conducted even two years earlier. Therefore, data from RCN databases have limited value for people, who want to understand the current situation on the market. Moreover, errors and mistakes unfortunately occur in the registers quite frequently – for example, a missing zero in the price. For this reason, abolishing fees alone, without simultaneously improving data quality and speeding up the process of feeding the registers, may deliver mainly a reputational effect rather than real analytical benefits.

MAP 1: TIMELINESS OF ENTERING TRANSACTIONS INTO THE RCN

source: https://www.gov.pl/web/gugik/kontrola-bazy-rcn

The problem is also that instead of being a single central database, the RCN is in fact a mosaic of 380 separate registers, each maintained independently by a county or city with county rights. Although these data are collected in digital form, not all county offices provide information electronically. While the Regulation on Land and Building Records obliges counties to provide RCN data online via web services, at present only 95 counties comply with this requirement. That is barely one quarter of all county offices.

Regardless of the fact that the “data for zero PLNs” principle will soon be in force, the question of how access to the RCN will actually be delivered remains unresolved. If the current model based on submitting individual requests is maintained, in the face of mass interest it risks significantly slowing down the work of offices and generating delays. On the other hand, making resources available exclusively via WMS/WFS services, although desirable for analysts, would restrict access to information for non-professional users, who do not have advanced visualisation tools.

The DOM Portal

In parallel, the government is working on launching the DOM Portal. The creation of a central, government-run and free-of-charge tool providing access to data on actually concluded residential property sale transactions, both on the primary and secondary market, is a key element of another amendment to the Developer Act, signed by the President on November 27, 2025. The launch of the portal is planned within 16 months from the promulgation of the Act.

The information collected by the DOM Portal will come from three sources: the Developer Guarantee Fund records, data supplied by developers and other professional entities involved in property sales, as well as notarial deeds provided by the National Revenue Administration (KAS). The portal will therefore show sale prices not only from notarial deeds, but also from development agreements.

The new tool will operate in two access models:

  • for all users (it will allow browsing statistics of transaction prices with filtering options by location, property type, usable floor area or number of rooms),
  • for public entities (extended access, crucial for analysing market turnover in the context of designing housing policy support instruments).

The effectiveness of the DOM Portal depends not only on how quickly data are updated, but above all on data quality, completeness and presentation. To protect personal data, individual users will not have access to information on specific transactions, but only to aggregated statistical results (based on at least six transactions). This makes it particularly important how the data are presented – whether they are understandable for end users. The greatest risk for the market does not lie in lack of access, but in insufficient interpretation of the data. Simple information on the average price per square metre is not enough. We need indicators that make it possible to assess the distribution and reliability of the data – so that the users knows whether they are dealing with a homogeneous market or with a set of transactions with high variability, where averages may deviate significantly from individual prices.

The trap of free data

The key issue, regardless of the platform (RCN or DOM Portal), is the origin, quality and timeliness of the data. Even the most advanced technological solution will not fulfil its role if the data are delayed, incomplete or difficult to interpret.

Opening up access to the RCN is a milestone, but free access to data does not mean free knowledge. For the average “Kowalski”, raw transaction data – even structured within the DOM Portal – will remain just statistics and medians. This is because they lack context. Analysing transaction prices requires specialist skills that makes it possible to account for key differences:

  1. transaction context: Was the transaction a “bargain” (e.g. a family sale, a sale by a receiver or trustee, a quick distress sale)? Raw data will not reveal this.
  2. condition and standard of the property: the RCN records the price, but will not tell us whether the flat required immediate investment, was in shell condition or after a full renovation. The difference in price per square metre between these states can be enormous. Or perhaps the property was subject to legal encumbrances?
  3. GDPR-driven aggregation: to protect privacy, transaction data in the DOM Portal must be aggregated (for example at neighbourhood level). This aggregation blurs details – the difference in value between a flat overlooking a park and one overlooking the bins, although crucial for the final valuation, is invisible in aggregated statistics.

For this reason, the transparency revolution does not make experts obsolete – it forces them to evolve. They must change their business model and move from being mere data providers to advanced analysts and contextual experts. Their added value will now lie in interpreting the data, comparing public list prices with transaction data and making precise valuation adjustments based on experience and context.

The next step – the Electronic Property Card

Despite the huge leap made in 2025, to achieve total transparency comparable with markets that have the highest standards, such as Sweden or Norway, we must combine price data with full information on the legal and physical status of the property.

This is where the postulate of introducing an Electronic Property Card (EKN) comes in. Although the EKN was not part of the 2025 legislative package, it is a logical consequence and the next key step in the market’s digital revolution. The EKN would be a digital “passport” for a property, integrating all key information in one easily accessible place – price data, legal status from the land and mortgage register and complete technical data – eliminating the need to repeatedly search multiple official registers.

Such a card would eliminate hidden legal and technical risks, which are often a bigger problem than the price itself. Only when the buyer has not just free information on the price, but also easy access to a full picture of the legal and technical status, will we be able to speak of the end of information asymmetry and true transparency.

Price transparency and market stability

It is worth looking at fully transparent markets such as Sweden and Norway, where property sale prices are publicly available. Similar rules also apply in Western European countries including Finland, Denmark, the Netherlands, Germany, Switzerland and the United Kingdom. In these countries, price information is usually easily accessible in public registers, often free of charge or for a small fee.

Analysing such markets provides valuable insights into the impact of transparency on price dynamics. Despite full transparency of transaction prices, the Swedish housing market experienced its deepest crisis in decades in 2022 – 2024, with house prices falling by almost 20% and flat prices by more than 10% compared with the 2022 peak (based on HOX Sweden Price Index reports). The price fluctuations were driven by rapid interest rate hikes by the Riksbank to curb inflation and the high share of variable-rate mortgages, which left many households exposed to rising costs. This example proves that price transparency does not protect the market from declines triggered by macroeconomic factors. On the contrary – it can accelerate market correction. Negative information is immediately absorbed by all participants, allowing the market to reach equilibrium more quickly. Full transparency eliminates price inertia, making the market more efficient and quicker to respond to economic realities.

Conclusions

Poland is becoming a market of prices transparency. Three legislative changes are creating a powerful foundation that enforces discipline on developers and empowers buyers.

  • For buyers, this will be a good time to purchase, because they have never before had so much knowledge and bargaining power. But they must remember: data without proper interpretation are just numbers.
  • For developers, it is a signal that they need to switch to a business model based on trust and discipline rather than on withholding information. The legal risks associated with errors in price lists are too great to ignore.
  • For professionals, it means the end of being “the gateway to data” and the beginning of being “experts in data interpretation”. Those, who fail to adapt, will disappear from the market.

Liberalising access to the RCN and introducing transparency of list prices is a key foundation – but only integrating these data with information on the technical condition (for example via the EKN) and developing the skills needed to use them will give us genuine transparency.

Agnieszka Pilcicka
Senior Real Estate Market Analyst