

Clean Transport Zones – do they actually affect air quality in European cities?
2026-03-03
At present, an increasing number of large European cities are designating within their boundaries a special areas known as a Clean Transport Zones (CTZ). Within such a zone, only vehicles that meet the relevant exhaust emission standards are permitted to circulate. These standards, referred to as Euro standards, are directly linked to the vehicle’s production date. Vehicles of all powertrain types (petrol, diesel, hybrid, LPG) may enter the zone, provided they meet the required exhaust-emission level. Each city delineates such an area independently – the boundaries of the zone are set by local governments under their own rules. CTZs usually cover up to a few percent of a city’s area, however, the positive effects of their introduction may be felt across the entire city. The primary aim of establishing CTZs is to reduce the level of pollution generated by transport. An additional benefit may also be a reduction in traffic congestion and noise levels. On a European scale, the equivalents of Clean Transport Zones are Low Emission Zones, although there are also ideas and attempts to introduce Zero Emission Zones.
There are currently around 320 Clean Transport Zones operating in Europe. Whether the designation of such areas in a city will have a greater or lesser impact on improving air quality depends on many factors, including:
- emission limit values,
- effectiveness of monitoring and enforcement within the zone,
- the types of vehicles permitted to circulate within the zone,
- the types of vehicles that used to circulate in the area before the zone was introduced,
- how high the level of air pollution was prior to the establishment of the zone.
On a European scale, it is possible to identify several Clean Transport Zones whose effects are best described and monitored.
London
In London, one of the most extensive zone systems in Europe has been developed. The designated areas have changed their boundaries several times, as the local authority sought to maximise the positive effect of introducing the zone. As a result, the Ultra Low Emission Zone has been in operation across the whole of London since 2023. The city’s core is also covered by a congestion charge (a daily fee for entering).
London’s city authorities monitor air quality and prepare periodic reports on the zone’s effectiveness. The latest report[1] (as of March 2025) includes, among others, the following conclusions:
- Nitrogen dioxide concentrations fell by 27% across London. Compared with 2019, NO2 concentrations in the city centre fell by as much as 54%; in the area referred to as Inner London they fell by 29%, while on the outskirts they fell by 24%.
- The expansion of the ULEZ also had a positive impact on PM2.5 emissions. Compared with 2019, these emissions on the outskirts were lower by as much as 31% (compared with the “without the ULEZ zone” scenario).
- Since the designation of the ULEZ, air quality has improved at as many as 99% of air-quality monitoring points. In addition, it was noted that the pace of improvement is significantly faster than in the rest of England.
- In the period 2019-2024, the ULEZ also contributed to a reduction in carbon dioxide emissions by 813 thousand tonnes.
The charts below show how nitrogen oxides (NO2) concentrations in London have changed over the years, along with successive stages of introducing the Low Emission Zone.
FIGURE 1. CHANGES IN NO2 POLLUTION CONCENTRATIONS IN LONDON, 2014-2024
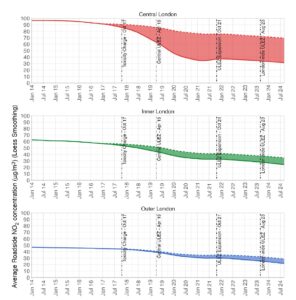
source: https://www.london.gov.uk/sites/default/files/2025-03/London-wide%20ULEZ%20One%20Year%20Report_Mar2025.pdf (accessed: 18 February 2026)
The Clean Transport Zone in London is in operation and is regularly monitored, optimised and modified, which enables the city authorities to achieve very good results reflected in a tangible improvement in air quality and a reduction in pollution emitted by transport.
Paris
The Paris clean transport zone (known as ZCR – Zone à Circulation Restreinte) has been in operation since 2019. Its boundaries are approximately defined by the A86 motorway. Entry to the zone is possible if the vehicle has a Crit’Air sticker. This solution has been introduced nationwide, which means that the same Crit’Air sticker designation entitles vehicles to enter cities such as Marseille, Lyon, Nice, Strasbourg and others.
A report prepared by AIRPARIF (the Paris regional air observatory)[2] shows that:
- in 2012–2022, residents’ exposure to nitrogen dioxide (NO2) pollution in Paris decreased by 40%;
- over the same period, the local community was also exposed to significantly lower levels of PM2.5 particulate pollution – by approx. 28%;
- CO2 emissions from traffic congestion fell by 35%.
These results were driven primarily by the direct consequences of introducing the clean transport zone: modernisation of the vehicle fleet and a reduction in congestion in the city, during which the largest amounts of pollutants are released.
Amsterdam
Amsterdam’s Clean Transport Zone was established in 2019 concurrently with the adoption of the “Clean Air Plan”. The city began by introducing a low-emission zone but, gradually and in line with the assumptions of a detailed plan, it is working, among other things, towards creating a zero-emission zone for public transport. The CTZ area (referred to as the Milieuzone) covers the area inside the A10 ring road. The time horizon for achieving full zero-emission status has been set for 2030.
The 2022 Air Quality Results Report published by GGD Amsterdam[3] shows key trends resulting from the introduction of the zone, as presented in the charts below.
FIGURE 2. Changes in NO2 and PM2.5 pollution concentrations in Amsterdam, 2013-2022
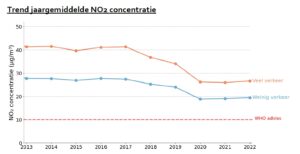

source: https://openresearch.amsterdam/image/2023/6/28/jaarrapportage_luchtmeetnet_2022_ggd.pdf (accessed: 18 February 2026)
The report emphasises that although pollution levels are significantly lower than in previous years, after the end of COVID-related restrictions and the renewed increase in car traffic, the decline in NO2 has slowed, which necessitates introducing subsequent stages of implementing zero-emission zones.
Poland
Currently, there are two Clean Transport Zones in Poland: in Warsaw (since July 1, 2024) and in Cracow (since January 1, 2026). Warsaw has covered approx. 7% of the city’s area with the zone (37 km2), while in Cracow it is more than half of the city’s area. The next Polish city planning to implement a CTZ is Wroclaw. Since zones in Poland have been operating for a relatively short time, there are still no data and analyses regarding their functioning and the measurable effects achieved.
Summary
Clean Transport Zones are a solution with positive effects, in particular for residents and local communities of individual cities. Restrictions imposed within the zones contribute to reducing air pollution generated by transport. It is worth remembering, however, that the designation of a zone is neither a one-off nor a uniform solution, as shown by examples from European cities. To maximise the positive impact, it is necessary to continuously monitor the zone’s operation and adjust the initially adopted assumptions (e.g. allow/ exclude specific vehicle types, expand/ reduce the territorial scope of the zone). Accordingly, over the years various trends in the operation of CTZs can be observed – some cities tighten regulations, while others lift zones after achieving specific targets. Although the introduction of CTZs certainly poses difficulties for part of the population, their primary objective is to safeguard residents’ health and air quality in cities. The effects of this element of urban policy depend primarily on the scale, duration and consistent monitoring and enforcement of the adopted assumptions. Implementing Clean Transport Zones in an informed and precisely planned manner can certainly have a direct and measurable impact on improving air quality in large cities, as evidenced, among others, by results presented in air-quality change reports prepared in individual cities.
Barbara Mariańska
AMRON System Maintenance and Development Specialist
[1] https://www.london.gov.uk/sites/default/files/2025-03/London-wide%20ULEZ%20One%20Year%20Report_Mar2025.pdf (accessed: 18.02.2026 r.)
[2] https://www.airparif.fr/sites/default/files/document_publication/PR%20-%20Paris%202012-2022.pdf#:~:text=They%20have%20resulted%20in%20an%20average%20reduction,road%20traffic%20have%20also%20fallen%20by%2035%25 (accessed: 18.02.2026 r.)
[3] https://openresearch.amsterdam/image/2023/6/28/jaarrapportage_luchtmeetnet_2022_ggd.pdf (accessed: 18.02.2026 r.)
Download report
